
ZX Spectrum development with modern tools
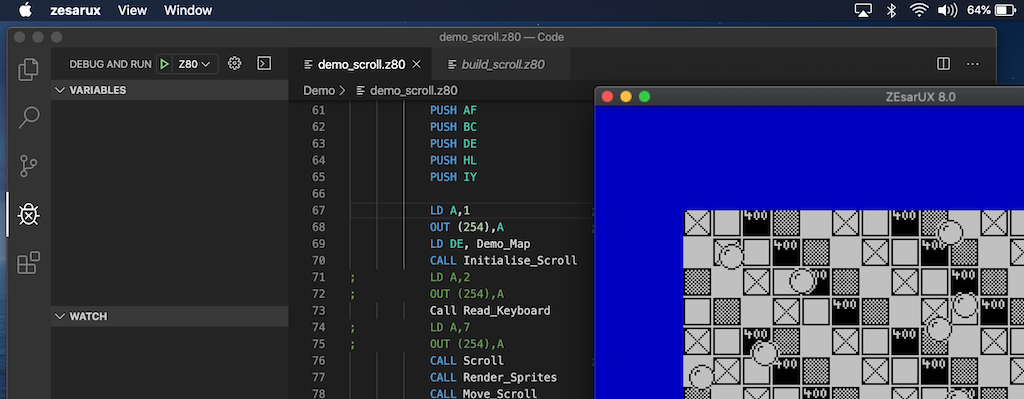
I’ve been using the ZXSpin emulator for a while now to develop code on the ZX Spectrum. This has many advantages, namely an integrated assembler and disassembler, but quite a few quirks, and the editor, whilst adequate for small projects, is not really up to scratch for large ones. In addition, my main machine is an old Macbook, so have to boot into Windows on it to do any software development.
My criteria for the new development environment was:
- Cost – it needed to be free for personal use
- Familiar – ideally an IDE like Visual Studio Code or similar
- Ease of use – should be able to do everything from the IDE
- Cross platform – should be able to run it at least on Windows and Mac
Based upon that, I’ve pulled together a toolchain and documented it on this page.
It’s a bit of a work-in-progress:
I cannot get ZEsarUX remote debugging working on Windows.- Sometimes ZEsarUX triggers MacOS SIP protection system when remote debugging.
- I’m not quite sure how to use the debugging tools yet…
- Not got any graphics or sounds tools yet.
I aim to refine these tools as I start using the tool to develop code.
Update: 02/02/2020
Based upon a recommendation by Alberto J. González (@alberto_mcalby) on Twitter, I’ve ditched zasm for the much easier to use (and better maintained) compiler sjasmplus. It still allows me to create TAP and SNA files, is a bit pickier on syntax, and I had to compile it to run on my Macbook, but it’s cross-platform, seems to be a better compiler, and there is a Windows installer available for it.
Update: 05/02/2020
Managed to get remote debugging working in Windows – looks like there are two Windows releases – one with, and one without remote debugging support. I’ve now got the Mac and PC versions up to the same standard now, and have modified the tool chain instructions page accordingly. Many thanks to David Gwyer (@dgwyer) on Twitter for some excellent feedback on improving document clarity, and a couple of tweaks to the setup process.
Update: 04/04/2020
Updated the documentation due to Maziac renaming their Z80 Debugger extension to DeZog. If you find that the debugger no longer works, and you’re getting a dialog box pop-up, then check out the toolchain page as I’ve updated the instructions accordingly.